Understanding the Data
The Escaped Ads New Hampshire project presents historical information, taken directly from primary sources, using a digital format. The dataset holds a wealth of information; when presented through visualizations the patterns and stories found through the data are made more accessible. The following visualizations show trends in the data, highlighting useful information about individuals living in nineteenth century New Hampshire and greater New England. The visualizations were created using only the data in the Escaped Ads New Hampshire data set and were generated using Microsoft Excel and Raw Graphs.
The visualizations below are broken down into two categories:
- Visualizations depicting data on the escapees.
- What choices were the escapees making in their acts of escape?
- What kinds of people were escaping and from where?
- Visualizations depicting data on the subscribers.
- What choices were the subscribers making when creating and posting the ad?
Some visualizations may appear small at first. Click on the image to enlarge the visualization and view it full screen.
The Escapees
Refers to the people listed in the ad as having left the presence of the subscriber.
One way to understand the data is through an analysis of the escapees. In doing this type of analysis, it is important to acknowledge that all information about the individuals is derived from their escape ad- a source that is created by the subscriber and reflects information from the subscriber’s point of view. For more information on methods and choices made throughout the project in regards to archival limitations please see the methods page.
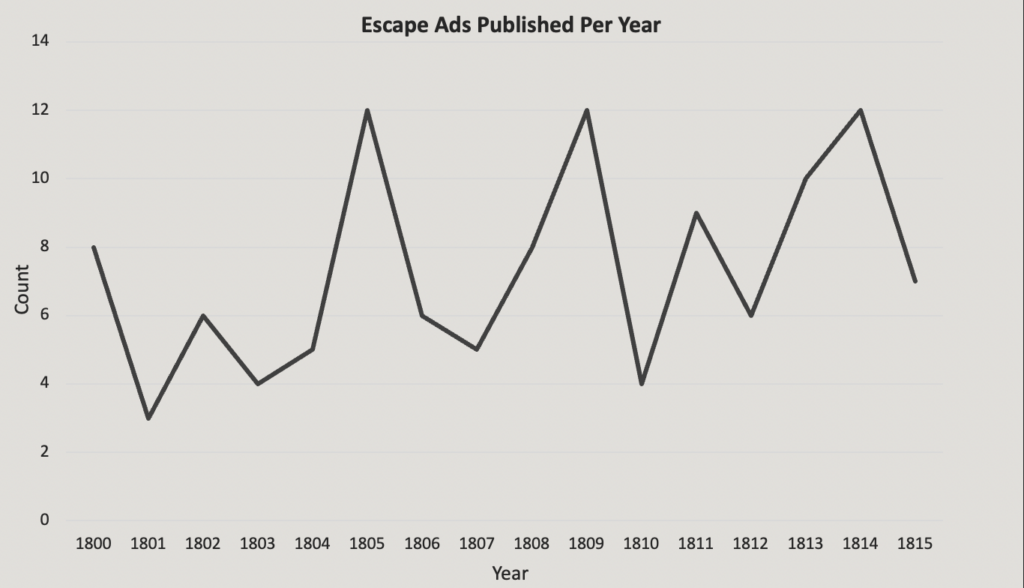
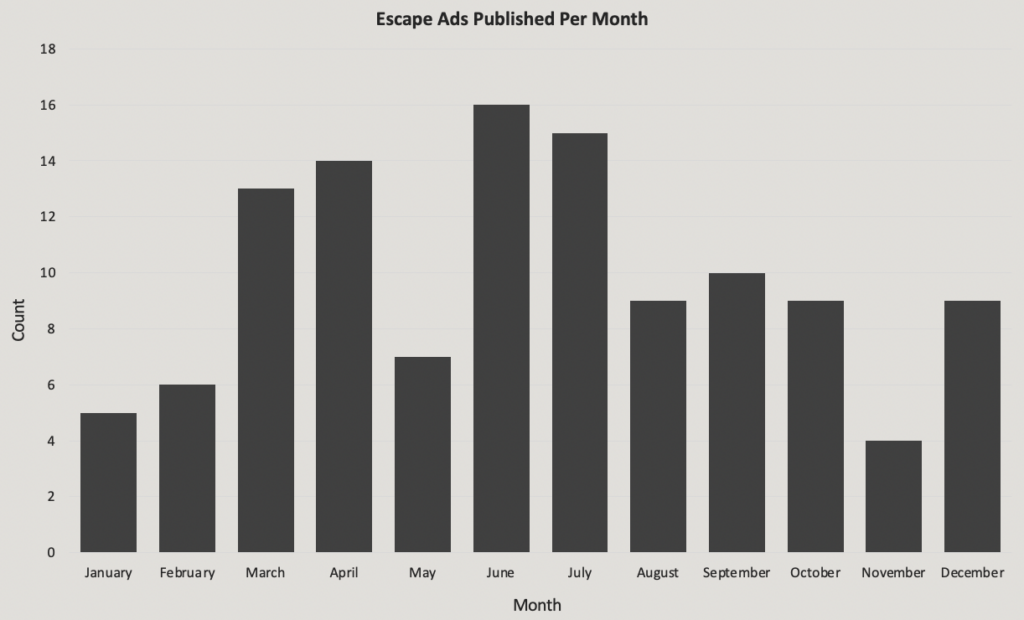
The two visualizations below analyze the times of year and month in which ads were published in the New Hampshire Sentinel. The dates of ad ad publication and even the dates on which the ad was written by the subscriber (these dates are separate columns in the dataset) do not necessarily reflect the exact day on which an individual left the presence of the subscriber. We can use the dates to generally understand when people were making acts of escape. Looking at Escaped Ads NH Visual 1, which reflects the amount of escape ads published over the course of the 15 year timeframe, there are clearly years in which more choices of escape were being made by individuals. The years 1805, 1809, and 1814 present the most ads of escape at 12 ads published each of those years. The least amount of ads were published in 1800 at 3 ads published that year. Escaped Ads NH Visual 2 reflects the time of year that people were choosing to make their escape. The time in which people made the decision to leave their current situations is important because it reflects choices that were being thought through and planned out by the individual. People certainly may have considered the time of year and factors like weather in their decisions. June and July have the highest amount of ads published, showing a potential correlation to warmer weather during these months. The second two highest months are March and April, possibly reflecting a desire to escape a situation after a rough New England winter.
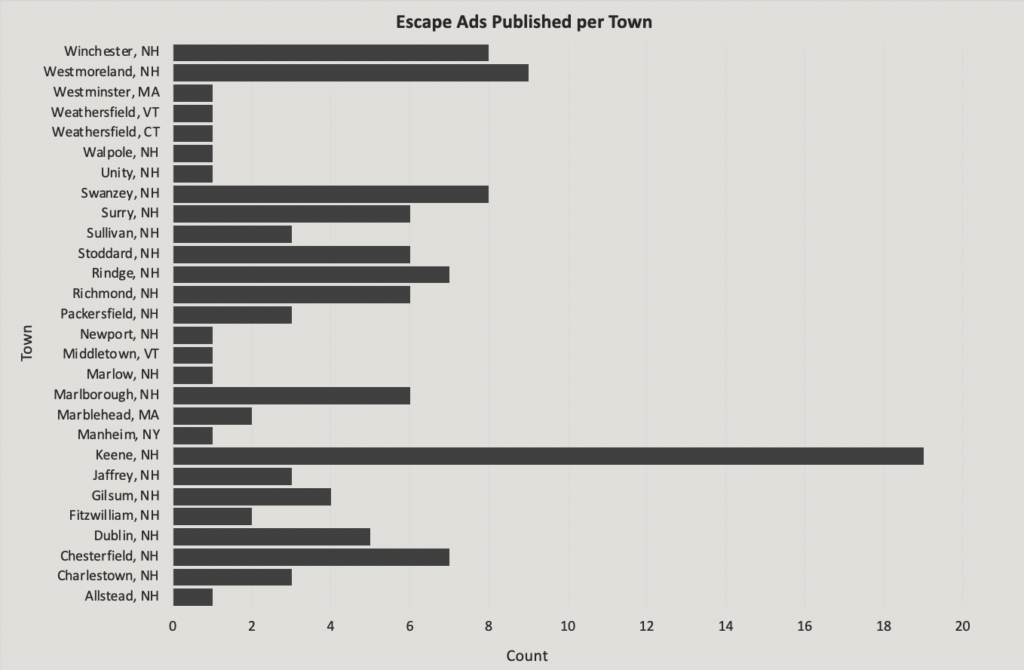
Another way to analyze the lives of the escapees is to understand where the individuals were living and/or working in. Escaped Ads NH Visual 3 depicts the amount of escape ads published per each town in the data set.
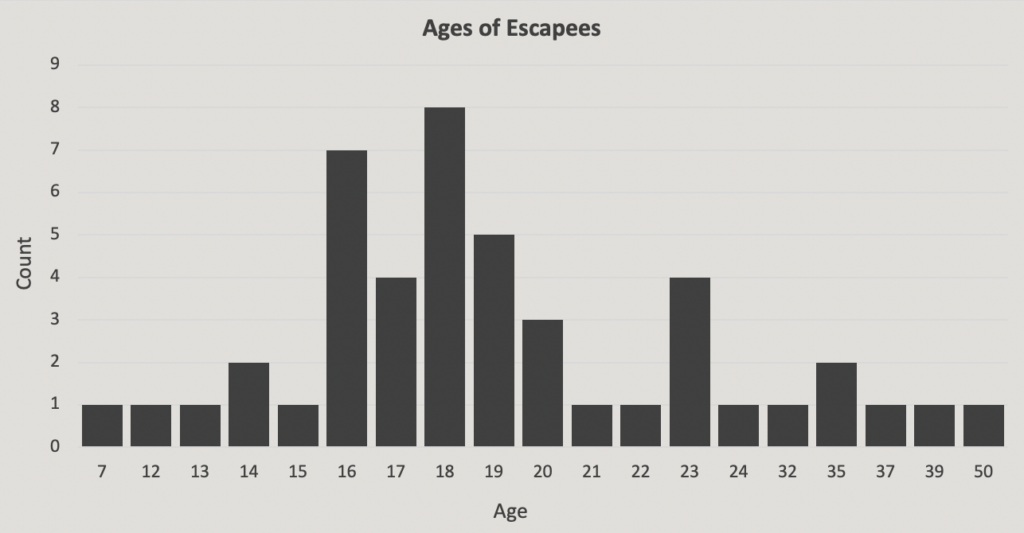
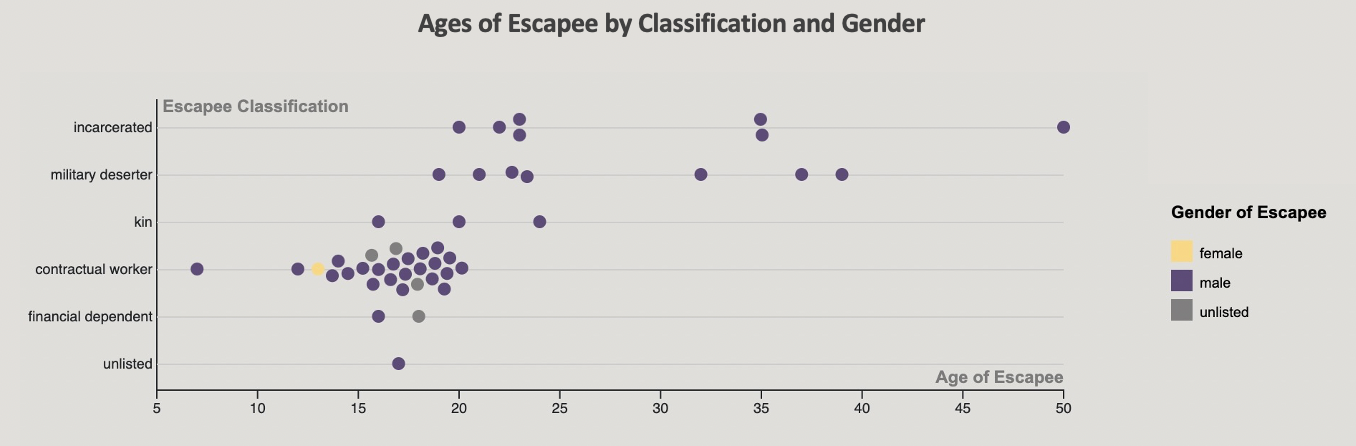
Another way to analyze what the data depicts about the escapees is through the information we are given in the ad about the people that were escaping. Escaped Ads NH Visuals 4 and 5 depict the general ages of escapees. Not every escape ad listed an age, so the visuals represent only the escapees whose ages were listed in the advertisement. Through Escaped Ads NH Visual 3, it is clear that the majority of escapees ranged from age 16 to 20. The youngest was 7 years old, while the oldest was 50 years old. Escaped Ads NH Visual 5, depicts the ages of escapees in a beeswarm plot that also uses the escapee classification and gender to further break down the information. Contractual workers ages were largely teens through younger twenties. Military deserters and incarcerated individuals ranged the most in age.
The gender of escapees can also be used to understand patterns in the data. Escaped Ads NH Visual 6 shows the amount of each gender that is listed in the ads, with unlisted representing ads that do not make note of a gender. According to this data, the majority of escapees were male. Escaped Ads NH Visual 7 uses the escapee classification to further break down which classifications were predominately male, female, or unlisted.
| Gender | Count |
|---|---|
| female | 42 |
| male | 67 |
| unlisted | 8 |

The Subscribers
Refers to the people who posted the ad in the New Hampshire Sentinel.
One way to understand the data is through an analysis of the subscribers. The subscriber made distinct choices when writing the ad for publication, including the information they chose to include about the escapee, or not include. The way these choices differed based on certain factors can also be analyzed.
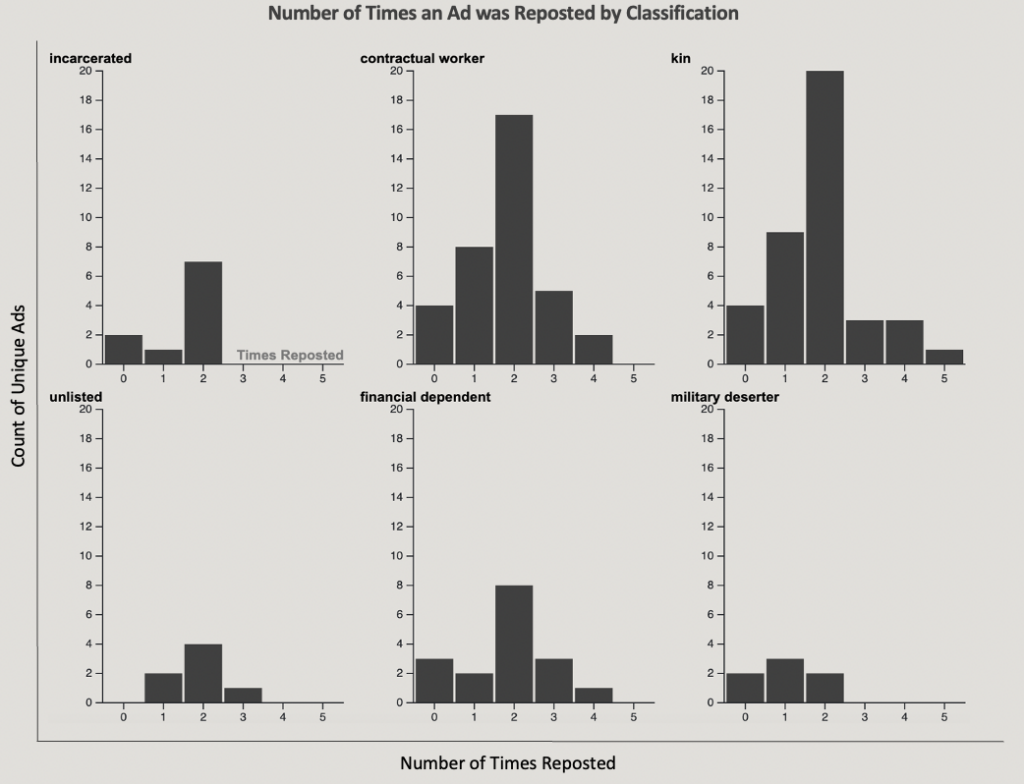
When posting ads in the newspaper, the subscriber could make the choice to publish an ad in just one weekly issue, or repost the same ad in multiple consecutive weekly issues. Further research would need to be done to understand why ads were reposted more than once and why they stopped at a certain amount of postings: Was the escapee found? Did the subscriber give up? Was it too costly to continue posting them? Escaped Ads NH Visual 8 uses the escapee classification to further break down how often ads were reposted.
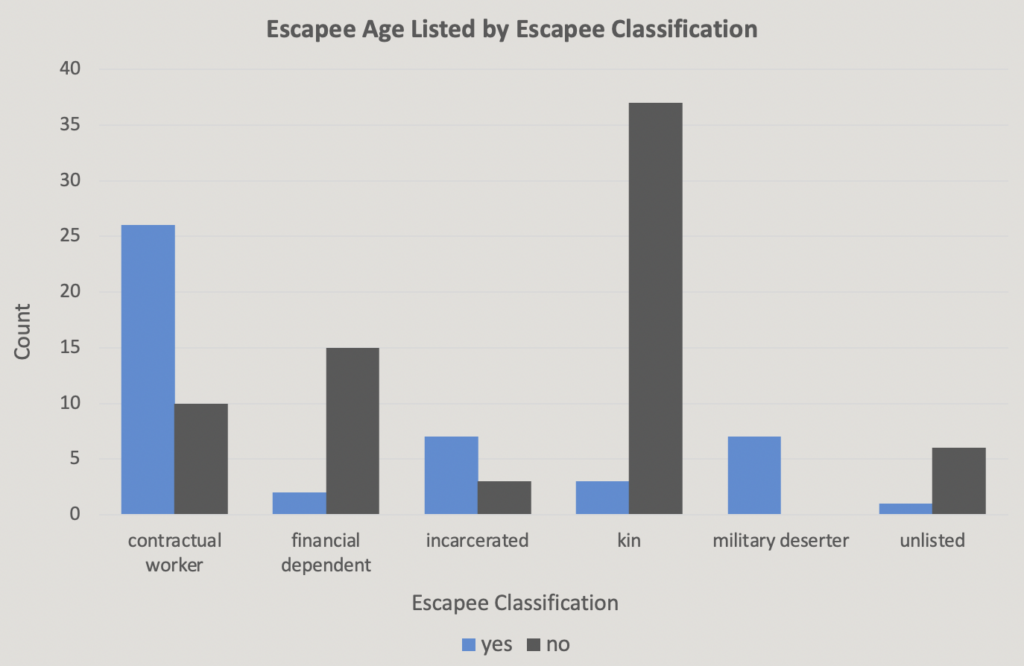
When creating an escape ad, the subscriber also made the decision of whether or not to include the age of escapee. Escaped Ads NH Visual 9 shows that the majority of advertisements did not list an escapee’s age. Escaped Ads NH Visual 10 uses the escapee classification to analyze which types of escapees were described in an ad by their age. The large majority of people that were described by their age was contractural workers, followed by incarcerated individuals and military deserters. Adding an age would presumably assist a person in identifying an individual.
| Escapee Age Listed in Ad | Count |
|---|---|
| No Age Listed | 71 |
| Age Listed | 46 |
When creating an escape ad, the subscriber also made the decision of whether or not to offer a reward for the return of an escaped individual. Escaped Ads NH Visual 11 shows that the majority of ads were not posted with a reward offer. Escaped Ads NH Visual 12 is useful for understanding how the escapee classification factored into decisions about offering a reward. Contractual workers received a reward significantly more often than other escapee classifications. The inclusion of a reward in an escape ad provided an incentive for the return of an escapee, revealing context for the value placed on different types of individuals and motivations for ensuring their return.
| Ads Posted with a Reward | Total |
|---|---|
| No Reward Offered | 71 |
| Reward Offered | 46 |

Subscribers also made a choice about how they listed the escapee’s name and whether or not they wrote out the individual’s entire name, or just their first name. Looking at the data set, this very clearly lined up with gender. Escaped Ads NH Visual 13 and 14 show that the large majority of males were listed by their full name. The opposite is true for females, who were actually more commonly described using only their first name. The inclusion of a surname would likely only make it easier to find an escapee and the choice to either include a surname or not include a surname may be reflective of the value placed on a person being found.
| Gender | Has Surname | No Surname Listed |
|---|---|---|
| Female | 15 | 27 |
| Male | 64 | 3 |
| Unlisted | 8 | 0 |
| Total | 87 | 30 |

Conclusions
The text contained in an escape ad is brief. At the absolute most, a subscriber included the escapee’s full name, gender, age, race, relation to them as the subscriber, and a description of the escapee (all from the perception of the subscriber). This is not a lot of information for understanding a person’s life. However, the above visualizations attempt to detect certain commonalities and outliers about the people that escaped and the people they escaped from.
The amount of information that is provided by a subscriber may reflect the amount of interest that person had in the person’s return. The more information that was included about a person, the more likely that person is to be found. When there is incentive to find that person in the form of a monetary reward, an increased desire for the person to be found can be assumed. Overall the data set and the visualizations above tell us that contractual workers were the type of escapee most valued in terms of their return to the subscriber. Contractual workers, who were largely males, had the most rewards amounts offered for their return, their full names listed, and the most identifiers like ages and descriptions included in ads about them. Alternatively, kin were the least likely to have these descriptors and rewards, and presumably therefore less prioritized for return.
When the description classification column in the dataset is analyzed, there are clear differences in the ways that men and women are described. Women are most typically described by subscribers using descriptors classified as “with child(ren)” and “behavior.” Men, on the other hand, were most typically described by subscribers using descriptors classified as “physical” and “attire.” For definitions of these classifications see the methods page. Describing a women’s actions towards the subscriber was not done in an attempt for others to be able to recognize them. Describing a man’s physical characteristics and the clothes they are wearing, however, would allow a person to more easily recognize the escapee.
There are a multitude of other ways that the Escaped Ads New Hampshire data set can be analyzed, visualized and understood. Possible avenues may be text analysis of the transcribed ads, using the names found in the data set to learn more about individual narratives, or simply adding more years to the current data set.
To see images of the ads in the data set and potential areas of interest for further research, see the exhibits page.